Distribution
Getting Your Planning Analytics Numbers to the Rest of the Business

Your IBM Planning Analytics model closes on time, and the numbers in it are the ones Finance trusts. Then the close week starts.
Where the close week goes
Someone exports each cost center's view from PAfE and cleans up the formatting. The numbers get pasted into a deck. The emails go out one recipient at a time, and nobody is sure which version each person received.
None of it needs your team's judgment. All of it takes their time. Picture a weekly distribution that costs a team about a day and reaches 50 recipients. That adds up to 52 analyst days a year, or 24% of one analyst's working year. Every one of the 2,600 sends is done by hand.
The fix starts with what you already built.
Start with the reports you already built
Your existing PAfE and Perspectives reports can go out exactly as they are. Split each one by a TM1 subset or dimension, or use an MDX query for finer control, and every recipient receives their own version. A cost center owner gets the cost center view. A market president gets their market.
A job runs on a schedule or the moment your load chore finishes. Call a sample TI process at the end of the chore, and the reports go out when the data is ready. Every send is logged, and nothing in your TM1 environment gets rebuilt.
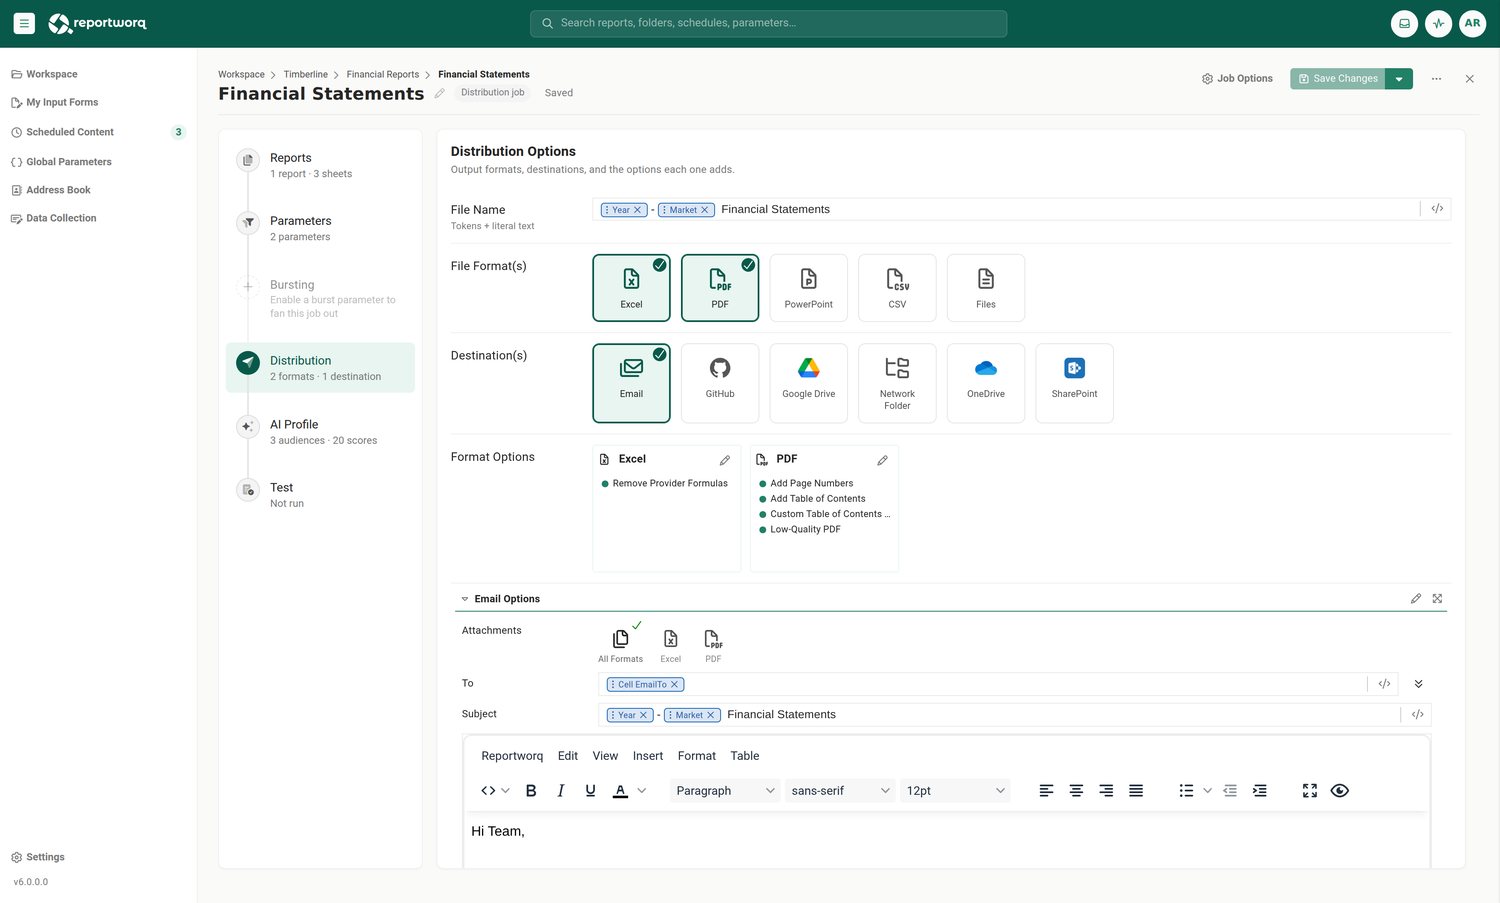
Synovus Bank went from two days of manual distribution every week to thirty minutes. Read the Synovus Bank case study.
How it fits alongside Planning Analytics
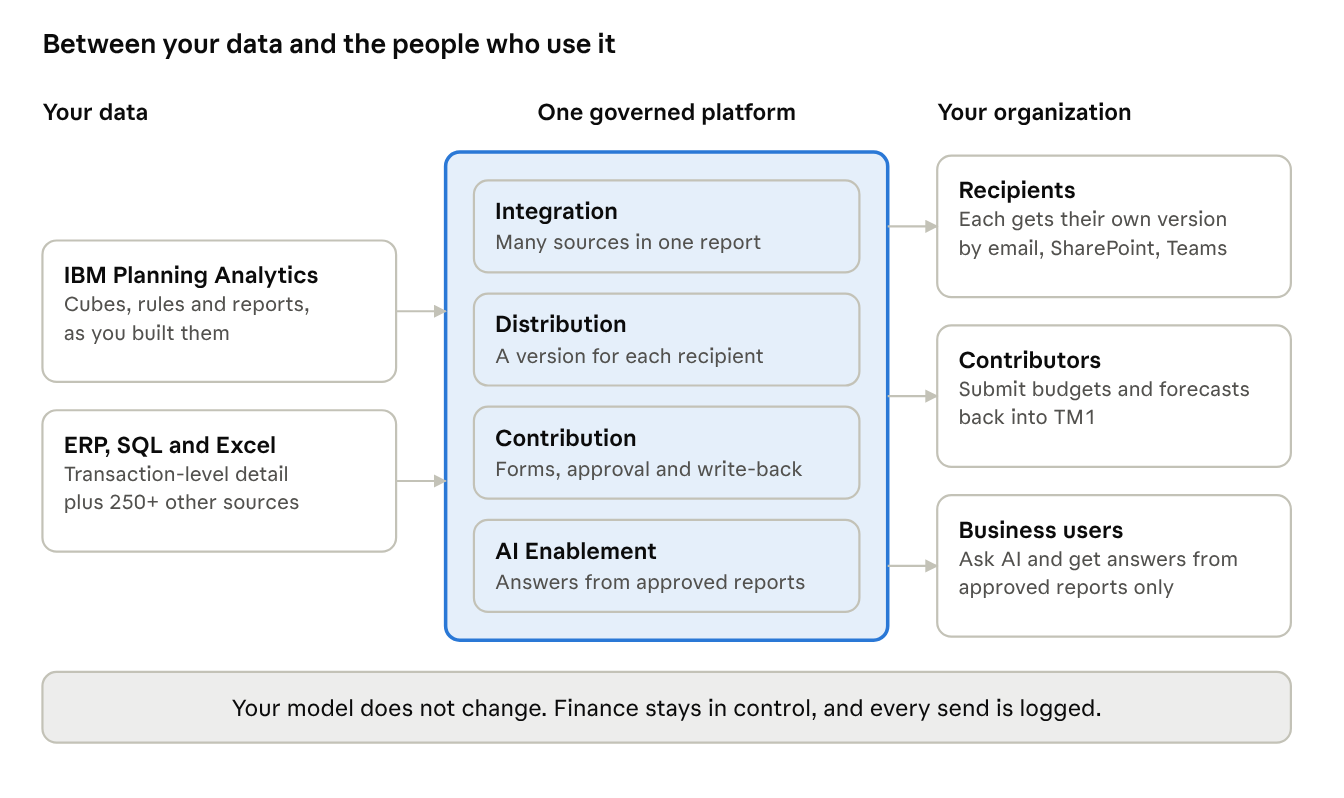
Your IBM Planning Analytics server stays where it is. Alongside it, Reportworq connects through the TM1 REST API with the integration credentials you set up. The diagram shows how the four capabilities connect your data to the people who use it, with Finance in control of who receives each report.
Bring in the numbers that live outside TM1
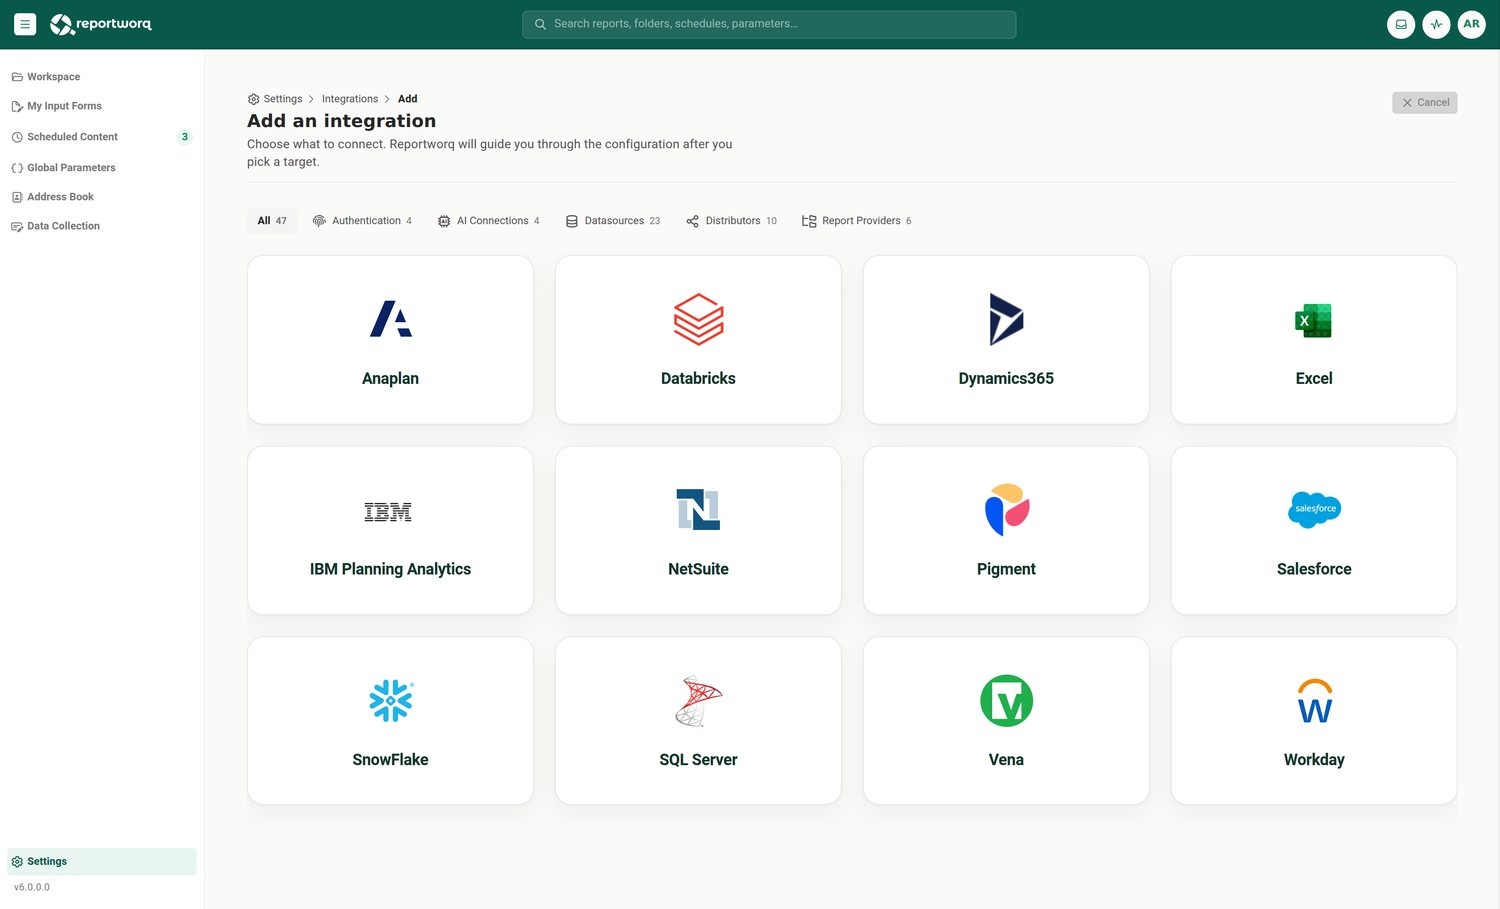
Your board package needs Planning Analytics figures next to SQL and third-party data, and today someone stitches them together by hand. With Reportworq, those sources come together in a single report, so your stakeholder gets one file instead of three. Choose from 250+ connectable sources.
Pregis pulls its monthly profit and loss report from three systems and delivers it to 15 cost center owners automatically, saving 5+ hours every month. Read the Pregis case study.
Bring budget and forecast input back into TM1
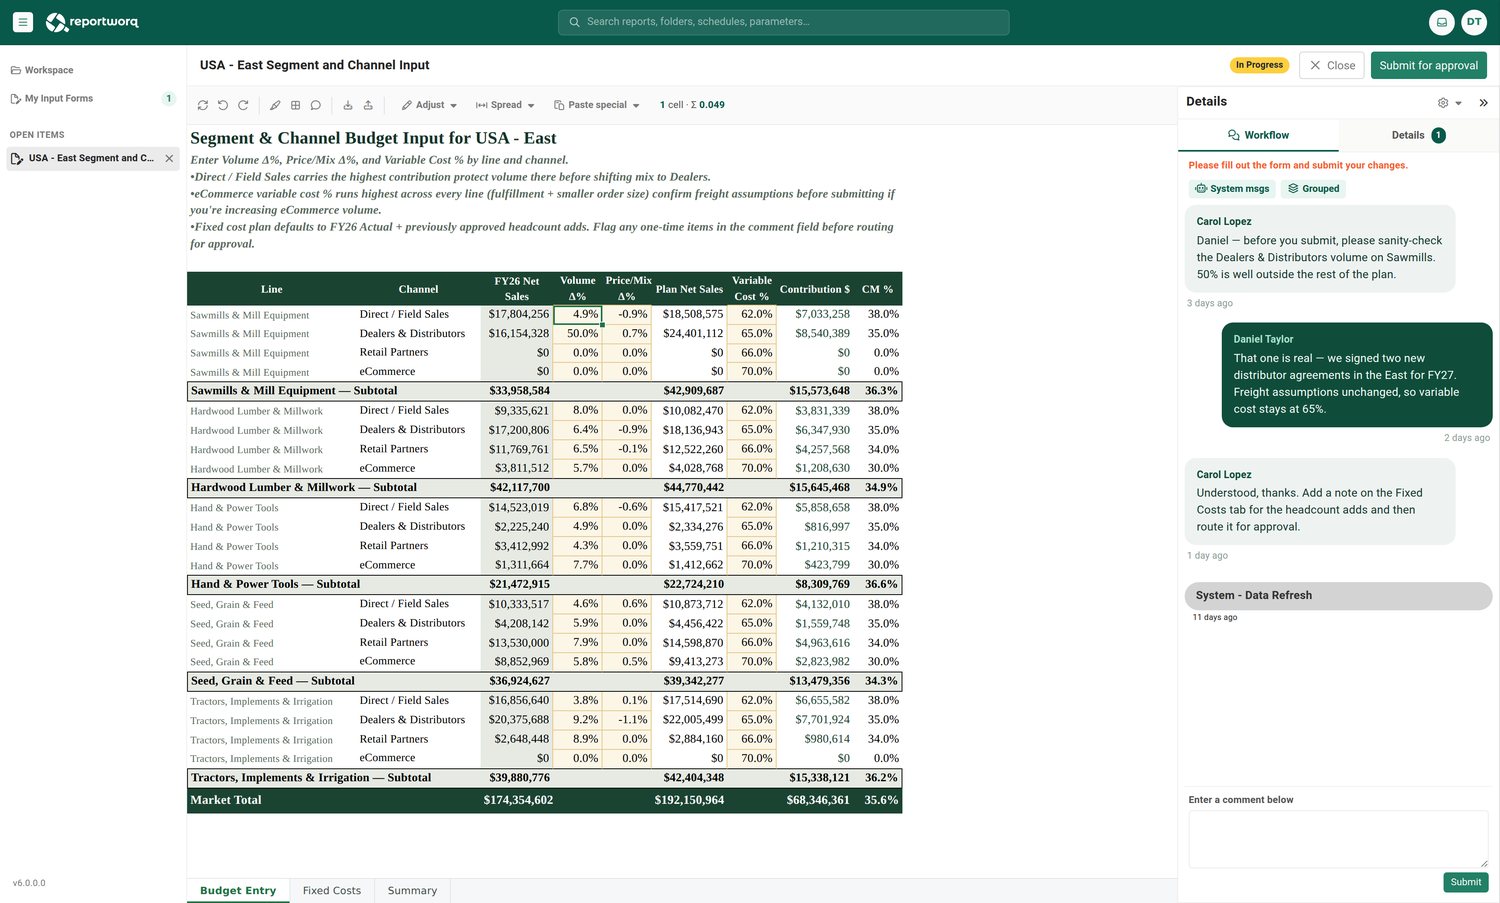
Today your contributors email spreadsheets back, and someone keys the numbers into TM1 by hand. Instead, each contributor gets an input form for their slice. Submissions go through approval and write back to your TM1 cubes, and you can see who has submitted at every step.
Townsquare Media added Contribution for quarterly forecasting, with every submission tracked in real time. Read the Townsquare Media case study. Nothing writes to your cubes unless you set up Contribution or data collection.
Let the business ask questions of approved reports
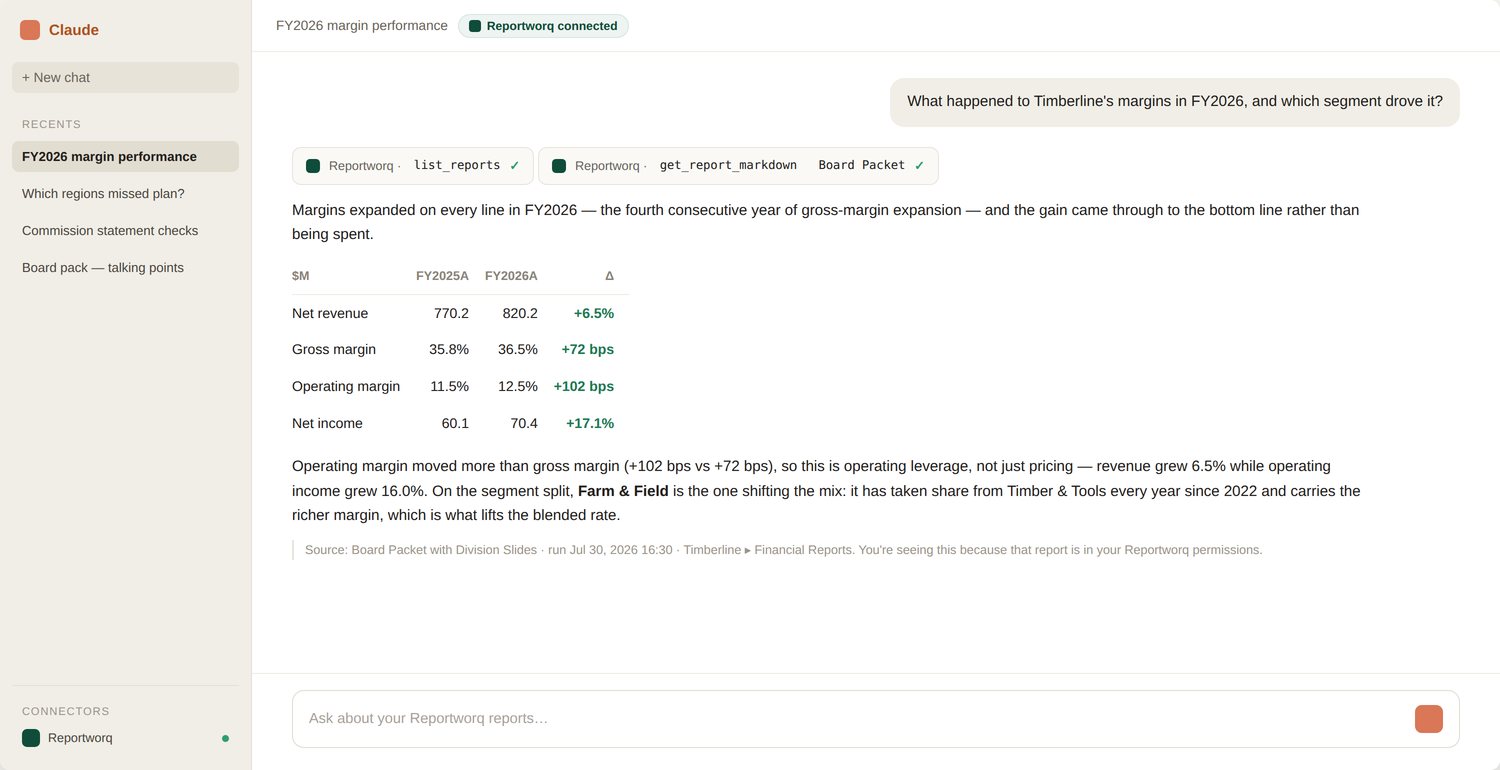
Your analysts already paste numbers into AI tools for quick answers, and nobody can see what went in or what came back. AI assistants such as Microsoft Copilot and Claude can answer from your finance-approved reports instead of raw cube data.
Every interaction is auditable: you see who asked and when, and which report supplied the answer.
What your TM1 team will want to know
The connection needs only the read access required to refresh your reports. Admin rights are needed once to install the optional TI process, and you can remove them afterward.
Custom and Dynamic Reports from PAfE run as built, as do Slices and Active Forms from Perspectives. Planning Analytics v11 and v12 are both supported, on self-hosted servers and on IBM Cloud. Self-hosted servers support every TM1 security mode.
Setup connects to your existing environment, and most teams are running in days. There is no implementation services engagement to wait on.
See it on your own numbers
Bring a report you send every cycle. A live walkthrough will show you the automated version, running on your own Planning Analytics data. Schedule a meeting.
Related: Reportworq for IBM Planning Analytics, and the business case builder that turns your own numbers into a Word document.
